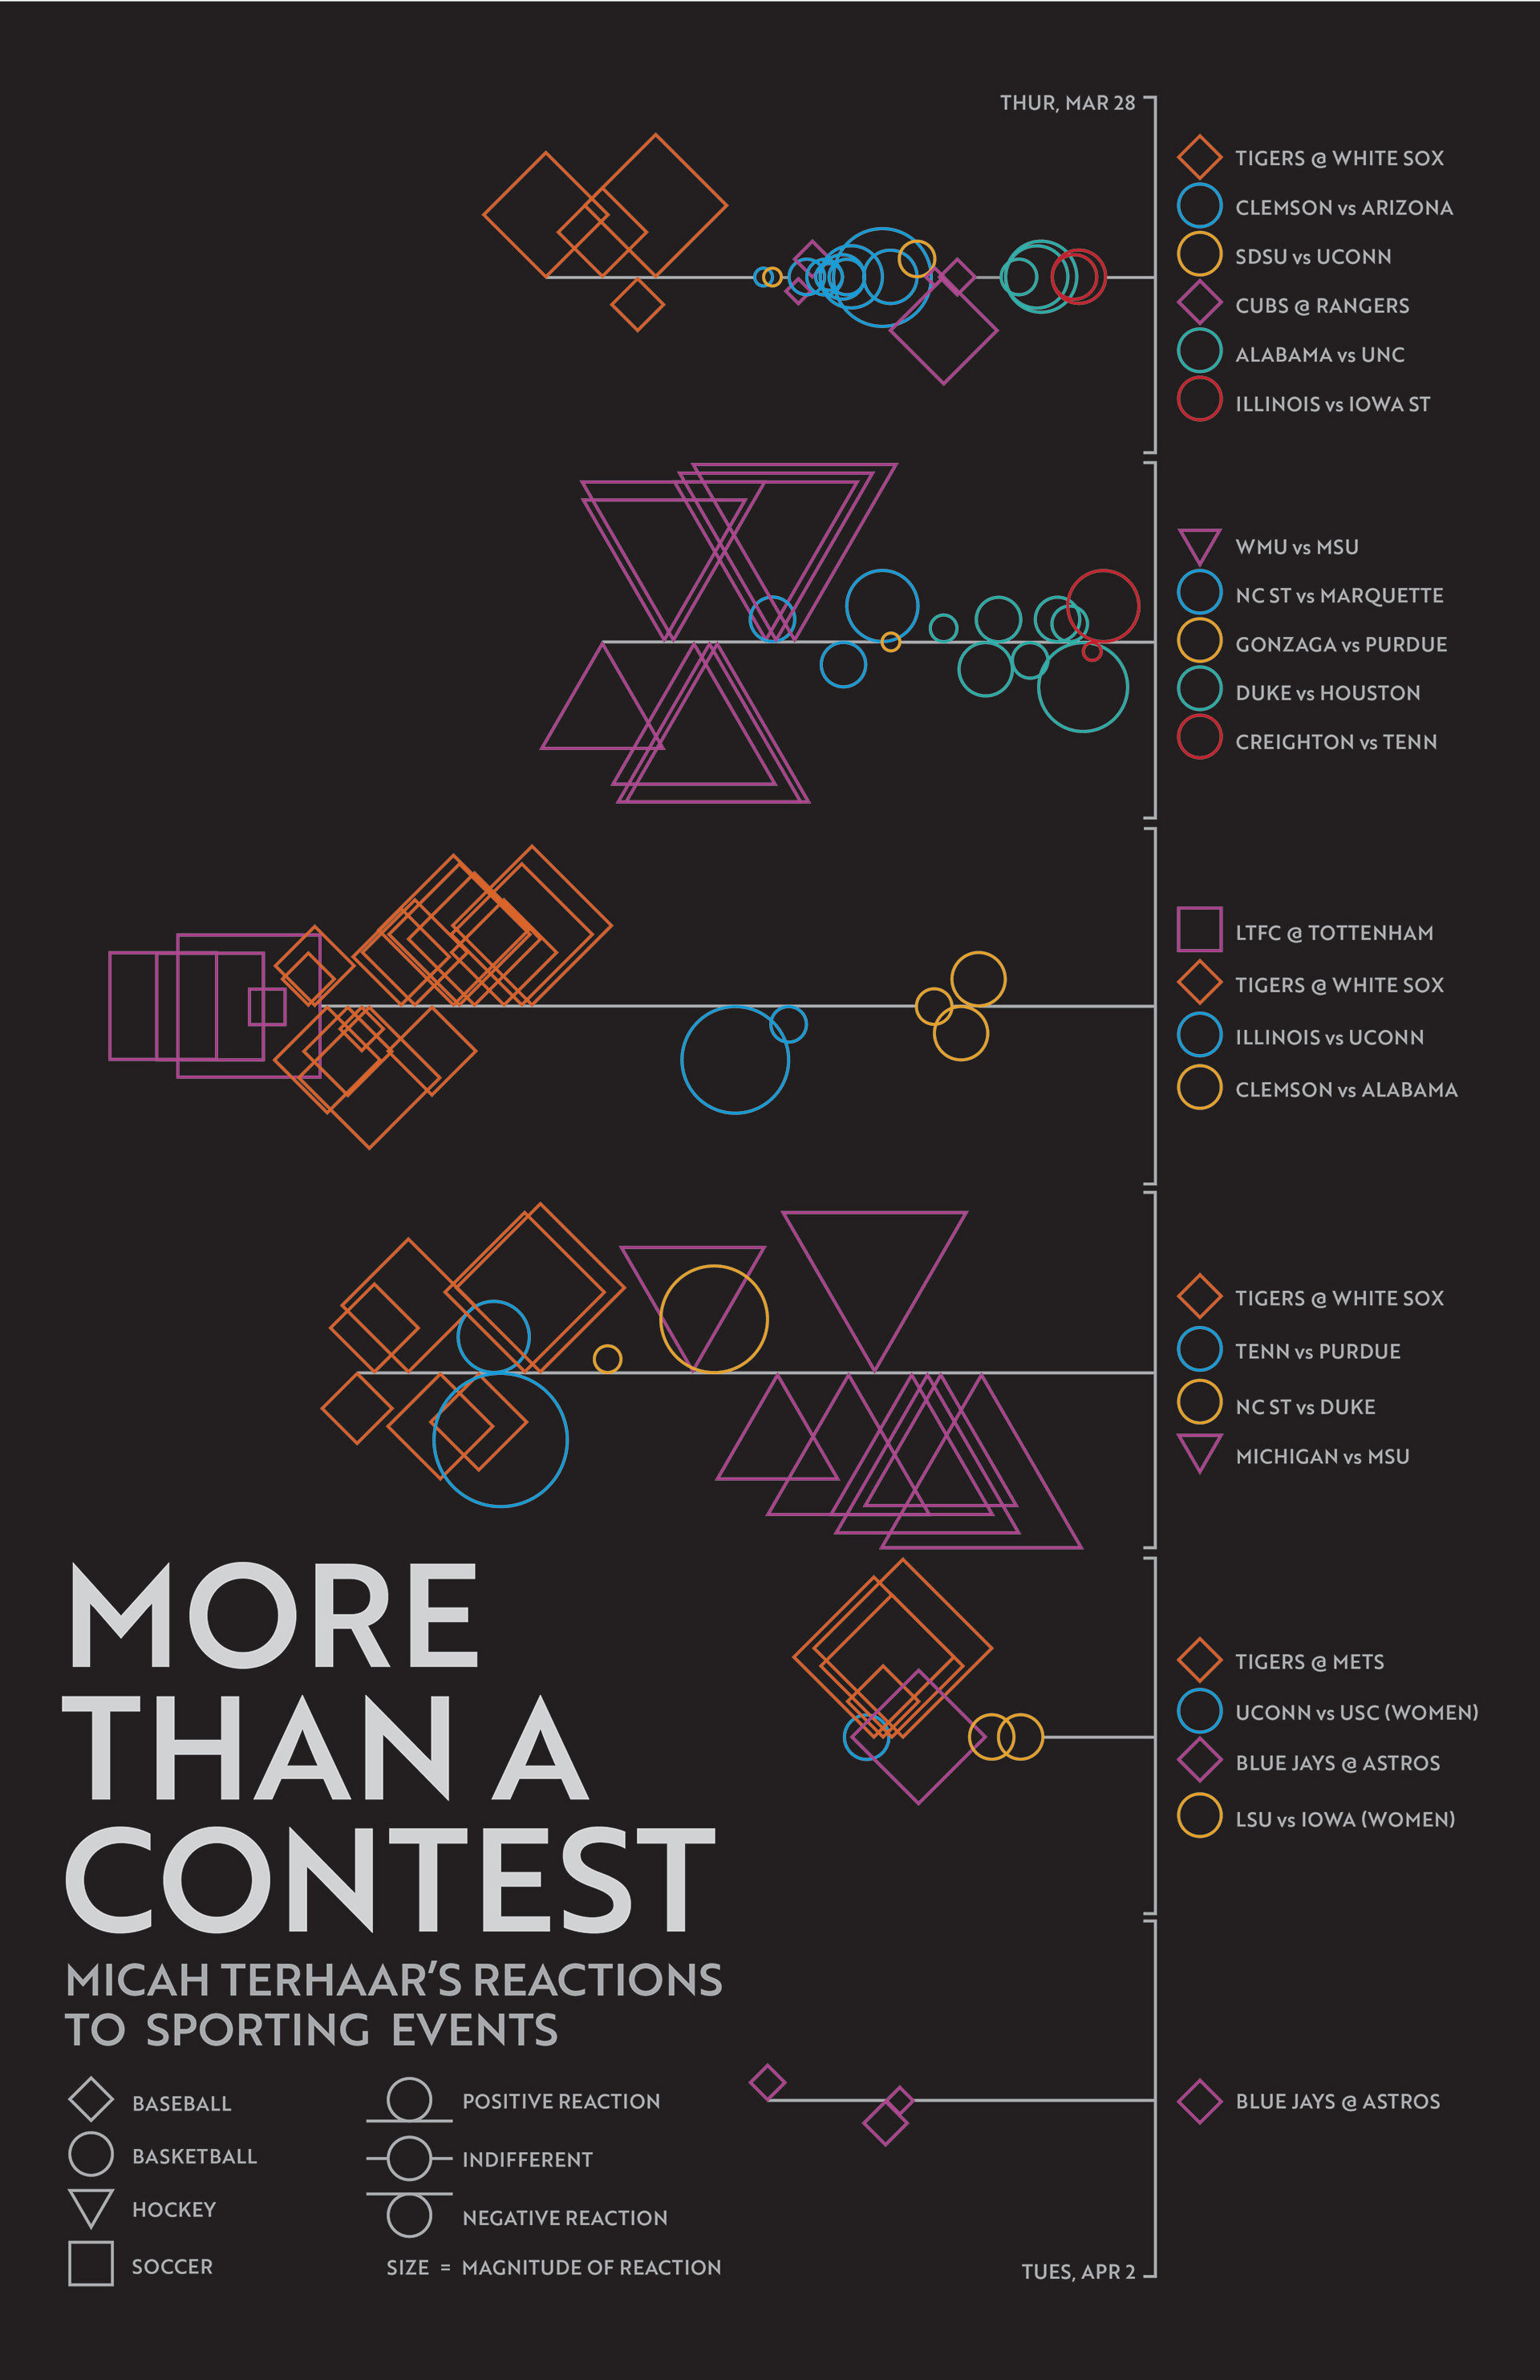
The Data Vis project was devoted to the gathering of information & turning it into a visually interesting & understandable graphic. I chose to track my reactions to sporting events that I watched throughout the week. Data included, game, date, time, magnitude of the reaction, & whether the reaction was positive, negative, or neutral.